In today’s fast-paced data-driven world, organizations must analyze data in real-time to make timely and informed decisions. Real-time data analytics enables businesses to gain valuable insights, respond to real-time events, and stay ahead of the competition. Also, the analytics engine must be capable of running analytical queries and returning results in real-time. In this article, we will explore how you can build a real-time data analytics solution using the open-source tools Redpanda a distributed streaming platform, Apache Superset, a data visualization, and a business intelligence platform, combined with RisingWave a streaming database.
There is a dedicated tutorial on how to monitor live stream metrics where you learn how to set up the project using Docker Compose, and how to create materialized views and query results with SQL. You can access the demo code needed to complete the tutorial in the GitHub repo here.
This article breaks down each component of the real-time streaming data pipeline architecture and dives into the details of how they interact with each other for our example live stream metrics analysis where data is ingested and analyzed in real-time from live streams to test video quality, or tracking the number of unique live viewers.
Real-time data analytics stack
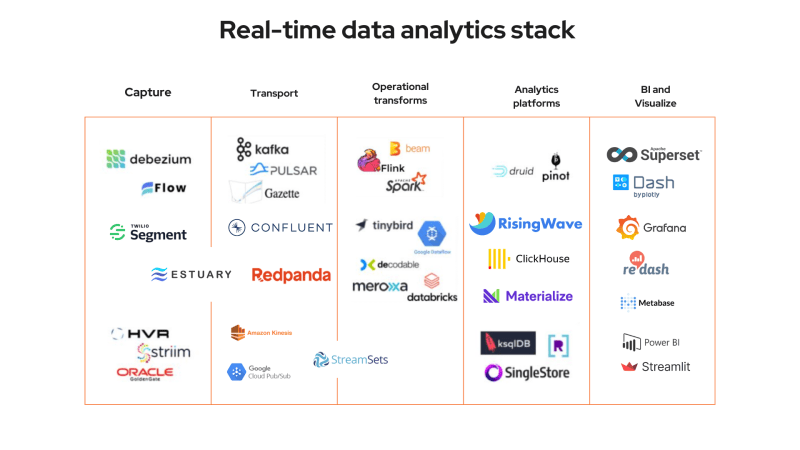
A real-time data analytics stack typically consists of a set of tools and technologies that are used to ingest, process, analyze, and visualize data in real-time. This table summarizes some common components of a typical real-time data analytics stack both open-source and enterprise:
Live stream analytics system architecture
Below is a diagram of the architecture for our sample project that process live streams and provides data in a BI (Business intelligence) dashboard.
Data stream producer
The first component in the above architecture is the data stream generator which is the Golang program in our case. Basically, it simulates incoming live metrics data, creates a Kafka topic called live_stream_metrics, and populates it with new raw live stream data. In reality, this can be replaced with your backend service that creates and write messages to Kafka topics.
You can also sync data from your persistent data sources like Postgres or MySQL databases using CDC(Change data capture), Debezium, and Redpanda. For example, as the database writes occur, Debezium exposes the change feed as streams to Redpanda.
Streaming data platform
We use Redpanda for real-time stream processing. It provides built-in support for stream processing using its embedded Kafka Streams API, allowing you to handle millions of events per second and providing low-latency data processing without JVM, code changes. This makes it ideal for ingesting and processing live stream metrics in real-time.
Streaming database
The next component, RisingWave is a streaming database specialized in real-time analytics that is designed to consume data from various sources such as ingesting data from Redpanda and creating materialized views, and making it possible to query Kafka topics using SQL. With the streaming database, the same query can run continually as data changes, creating SQL-based data for monitoring.
Connect RisingWave to Redpanda
Now assume those live stream events coming into Redpanda from the stream producer, we can connect RisingWave to Redpanda to receive real-time events. To do so, we create a source in RisingWave using the CREATE SOURCESQL statement:
CREATE SOURCE live_stream_metrics (
    client_ip VARCHAR,
    user_agent VARCHAR,
    user_id VARCHAR,
    -- The live room.
    room_id VARCHAR,
    -- Sent bits per second.
    video_bps BIGINT,
    -- Sent frames per second. Typically 30 fps.
    video_fps BIGINT,
    -- Round-trip time (in ms). 200ms is recommended.
    video_rtt BIGINT,
    -- Lost packets per second.
    video_lost_pps BIGINT,
    -- How long was the longest freeze (in ms).
    video_longest_freeze_duration BIGINT,
    -- Total freeze duration.
    video_total_freeze_duration BIGINT,
    report_timestamp TIMESTAMPTZ,
    country VARCHAR
) WITH (
    connector = 'kafka',
    topic = 'live_stream_metrics',
    properties.bootstrap.server = 'message_queue:29092',
    scan.startup.mode = 'earliest'
) ROW FORMAT JSON;
In the above example, RisingWave subscribes to the topic live_stream_metrics in Kafka using Redpanda (message_queueservice is a Redpanda instance in Docker) and we specified what fields we are interested to read from the topic. However, RisingWave only starts to consume data in real-time from the Kafka topic only after we create a materialized view.
Create a materialized view for view counts
A new materialized view will track the number of unique viewers on the entire streaming site every minute. We will use the tumble function to map each event into a one-minute window and count the number of distinct viewers within each time window.
-- A real-time dashboard of the total UV.
CREATE MATERIALIZED VIEW total_user_visit_1min AS
SELECT
    window_start AS report_ts,
    COUNT(DISTINCT user_id) AS uv
FROM
    TUMBLE(
        live_stream_metrics,
        report_timestamp,
        INTERVAL '1' MINUTE
    )
GROUP BY
    window_start;
Now, we can query the results with the following SQL statement.
select
    *
FROM
    total_user_visit_1min
LIMIT
    1;
BI and data analytics platform
The fourth component in our architecture is a user-facing data analytics dashboard. Once our streaming database is set up and receives live stream metrics data, we need to configure Apache Superset to connect to it. It provides a web-based interface for data exploration and visualization, making it accessible to users with little to no coding experience. It supports a wide range of data sources. With Superset, you can explore real-time data in various ways, such as filtering, drilling down, and aggregating data based on different dimensions and measures.
You can configure Superset to connect to RisingWave by using custom SQLAlchemy database configurations. This guide shows how to configure Superset to read data from RisingWave, create a dashboard and visualize the materialized views we created in a table view.
Conclusion
In summary, Redpanda, RisingWave, and Superset provide a powerful and scalable solution for live stream metrics analysis, allowing you to ingest, process, store, visualize, and analyze live stream metrics data in real-time. They are well-suited for handling large-scale, high-velocity data streams and provide an end-to-end solution for monitoring and analyzing live stream metrics in a modern, distributed, and user-friendly manner.
Related resources
Recommended content
Community
🙋 Join the Risingwave Community
