Introduction
With the rise of cloud data warehouses and Business Intelligence, more and more organizations are starting to use Snowflake. While using Snowflake at scale, it’s imperative for data teams to have deep visibility into Snowflake costs & performance.
In this article, we will go over the 5 best tools for Snowflake observability. This can help data teams track their Snowflake costs, optimize Snowflake queries, and thereby reduce Snowflake costs.
Let’s dive in to find out how these powerful Snowflake Observability tools can make it easier for you to optimize Snowflake costs!
What is Snowflake Observability?
Observability is the ability to monitor a system’s performance using data collected from different parts of the system and perform a root cause analysis. This data is generated through tools and processes that are set up to track and measure system health and performance. (Read more on Observability vs Monitoring here)
“Snowflake Observability” means monitoring the health and performance of a Snowflake instance. By leveraging the power of Snowflake Observability tools, users can generate insights into the performance and behavior of their Snowflake data warehouse, identify/diagnose issues, and find the underlying root cause. These Snowflake Observability tools can also help data teams optimize Snowflake queries, reduce their resource consumption and improve performance. This can lead to more efficient use of Snowflake resources, ultimately helping them to reduce Snowflake costs.
5 best tools for Snowflake Observability
1) Snowflake Resource Monitors
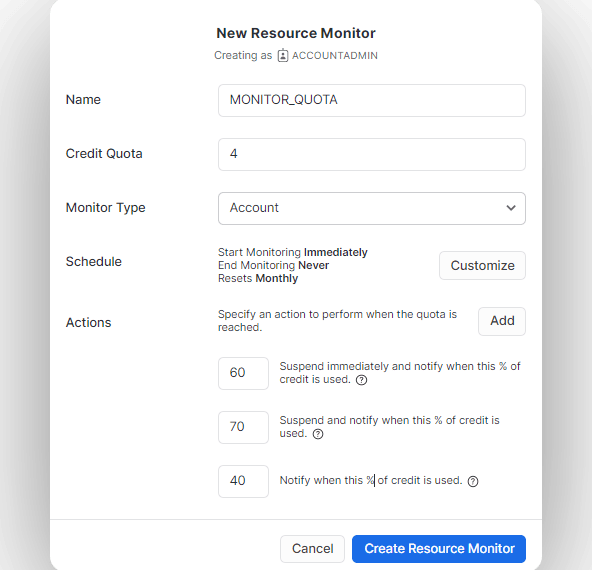
Resource monitor is an official tool built by Snowflake for monitoring costs and avoiding unexpected credit usage caused by warehouse operations. It is the only tool that can monitor credit consumption and control (turn on or off) warehouses. It allows users to monitor credit usage and set limits for a specified interval or date range. Resource monitors can trigger various actions, such as sending alert notifications and/or suspending user-managed warehouses, when credit limits are reached or approached.
Note: Account administrators with the ACCOUNTADMIN role are the only ones who can create resource monitors. However, users with the MONITOR & MODIFY privileges can view and modify them.
Key features:
- Cost control: It provides a way to limit the number of credits that Snowflake Data Warehouse can consume, helping you to manage costs and avoid unexpected credit usage.
- Credit usage visibility: It provides users with a detailed overview of the credits they have consumed.
- Monitor level: It allows users to set the monitor level to monitor credit usage for either the entire account or individual warehouses.
- Custom monitoring schedules: It gives users the ability to set a custom schedule for when to start and stop monitoring credit usage.
- Actions: It provides users with the ability to set up triggers or actions that specify a threshold for credit usage, allowing them to take action when that threshold is reached.
- Custom alerts and notifications: It alerts users with notifications by email or in the web interface when a monitor triggers an action (notifications must be enabled), giving users a high level of customization and control over their credit monitoring process.
- Flexible warehouse reactivation: It provides users with the ability to reactivate suspended warehouse by increasing the credit quota or threshold associated with the monitor.
2) Chaos Genius
Chaos Genius is a Snowflake DataOps Observability Platform. Chaos Genius is designed to help data teams manage and optimize their Snowflake data warehouse. It enables users to gain complete visibility into the performance of their Snowflake data warehouse and identify any key areas where they can improve efficiency, optimize query performance, and reduce Snowflake spending.

Key features
- Snowflake Costs Dashboard: It provides real-time visualization of the costs associated with running a Snowflake data warehouse, which allows users to monitor Snowflake usage and identify key areas to reduce Snowflake costs.
- Snowflake Warehouse Optimization: Chaos Genius helps data teams monitor and optimize Snowflake costs across different warehouses. It gives automated recommendations on warehouse right-sizing by identifying underutilized infrastructure.
- Snowflake Query Optimization: It analyzes query patterns to identify inefficient queries and provides recommendations for improving performance.
- Snowflake Storage Costs Optimization: It analyzes the storage usage patterns, identifies unused tables, and provides recommendations for optimizing storage costs.
- Usage Reports & Alerting: It offers detailed usage reports and alerting features via email and Slack, providing users with a clear point of view of Snowflake usage and helping them identify any issues or anomalies.
- Anomaly Detection: It helps users identify unusual usage patterns or unexpected costs, enabling them to quickly investigate and address any potential issues.
3) New Relic – Snowflake Integration
New Relic is an observability platform that lets users monitor, optimize, and fix their apps and infrastructure. The platform is capable of monitoring applications/infrastructure as well as being good at managing logs and errors.
There are numerous accessible New Relic integrations available, including Snowflake.
Integrating New Relic with Snowflake provides users with enhanced Snowflake observability, allowing them to gain a complete picture of their Snowflake’s costs, performance, security, and availability.
Key features:
- Interactive Dashboards: It provides a dashboard with interactive visualizations.
- Alerts: It comes with 4 different alerts, such as bytes spilled to local or remote storage, failed queries, and queued queries. These alerts can be easily integrated into popular tools like Slack and PagerDuty.
- Warehouse performance monitoring: It helps users monitor the performance of their Snowflake warehouse.
- Custom data export: It offers easy export of custom data from Snowflake for external analysis and reporting.
- Data ingestion: It allows users to ingest any data stored in Snowflake for comprehensive monitoring and analysis.
- Inefficient Query Spotting: It points out inefficient queries by filtering longest-running queries and helping users to optimize the query performance and improve overall efficiency.
- Integrations: It integrates with many tools and services, such as cloud platforms, messaging, and logging services.
4) Datadog – Snowflake Integration
Datadog is another cloud-based observability platform. It provides comprehensive, real-time visibility into your entire infrastructure, including cloud environments, servers, databases, applications—and much more. It enables users to monitor, troubleshoot, and optimize performance across their entire tech stack and provides a centralized dashboard for alerting/monitoring your usage, allowing you to identify potential issues quickly.
The platform integrates with well over 500 technologies. You can use the Datadog monitoring service On-Premise or as a Cloud-Based service. You can also use it with various cloud providers, including Snowflake, thus providing enhanced Snowflake observability. By using Datadog for Snowflake Monitoring, you can track Snowflake performance, identify long-running queries, and optimize them for faster results, which can ultimately help reduce Snowflake costs.
Key features:
- Data usage monitoring: It enables users to monitor their Snowflake data usage to identify trends and optimize their Snowflake storage costs.
- Cost analysis: It provides a detailed cost analysis for Snowflake that allows you to visualize and track the costs, and see what’s driving them.
- Intuitive dashboard: It provides an intuitive and interactive dashboard to help you to visualize your Snowflake environment, including metrics such as warehouse utilization, query performance, and so on.
- Anomaly detection: It helps users in detecting abnormal Snowflake storage usage patterns by comparing current usage to historical patterns and provides monitoring for the fluctuation in storage usage.
- Misconfiguration detection + smart alerts: It can detect misconfigurations in users’ Snowflake environment and send alerts when something unusual configuration is detected.
5) BI Dashboards: Snowflake Usage Templates
Snowflake offers basic BI dashboards on different BI platforms. While these do not offer observability, these are good first steps to get on top of your Snowflake usage and performance. Some of these dashboards are mentioned below:
However, these dashboards are basic visualizations and don’t offer any insights into optimizing warehouses, right-sizing them, query performance tuning etc.
Conclusion
Any business or organization that starts using Snowflake at scale must have Snowflake observability enabled. For small businesses, these can be as simple as BI dashboards provided by the likes of Looker, Thoughtspot or Tableau. Sometimes, data teams can also spin their own dashboards in Snowsight and use features like resource monitors to keep on top of costs.
However, as workloads and Snowflake users increase, it leads to the use of more powerful Snowflake Observability tools like Chaos Genius – which give advanced features like warehouse right-sizing recommendations, query tuning & performance improvement recommendations, storage cost reduction recommendations, in addition to alerting & reporting.
It’s never too early to get started on Snowflake Observability!


